
The average Guildford home sold for £532,917 in July 2026, down 2.2% in a year while England rose 1.1%. Prices by type, the priciest streets, what it means.
The average home in Guildford borough sold for £532,917 in July 2026, and the direction of travel is the story: that figure is down 2.2% on a year earlier, at a time when prices across England rose 1.1%. Asking prices in agents’ windows tell you what sellers hope for; the numbers on this page are what homes actually changed hands for, recorded by HM Land Registry once each sale completes and published as the UK House Price Index. Here is the full picture: the average by property type, the borough’s most expensive and cheapest streets, and how Guildford sits against Surrey and the rest of the country.
The headline figure, and why it is falling
The £532,917 borough average for July 2026 is the provisional figure from the official UK House Price Index, built from completed Land Registry sales across the whole of Guildford borough, from the town itself out to Ash, Ripley, Send, the Horsleys and the Tillingbourne villages.
Three things stand out in the latest data:
- Prices fell 2.2% over the twelve months to July 2026, a fall of £12,038. June 2025 was the highest monthly average the borough has ever recorded, at £555,269, so the drop is measured from an all-time high rather than from a normal level. July 2026 is £22,352 below that peak.
- The annual fall is shrinking fast. It was 5.4% in May and 5.2% in June. July also rose 1.3% on the month, the second monthly rise in a row.
- The borough is still going the other way from the country. Over the same twelve months England’s average rose 1.1% to £293,479 and the South East rose 0.2% to £380,878. Guildford’s premium is coming off the top, which is what tends to happen when higher mortgage costs meet a market where the average home costs over half a million pounds.
One caveat worth carrying: UKHPI figures are provisional and get revised as late-registered sales arrive, so treat the precise decimal as an estimate that will settle over the next few months. June 2026 is a live example. It was first published at £523,974, a fall of 5.6%; the July release raises it to £526,169, a fall of 5.2%. Against that revised June figure, July was a 1.3% rise.
Updated 18 September 2026 with the July 2026 release. This page previously carried the first-published June 2026 figure of £523,974, which the Land Registry has since revised up to £526,169.
What you pay by property type
The borough average hides an enormous spread. These are the July 2026 averages from the UK House Price Index for Guildford, with the change over the year:
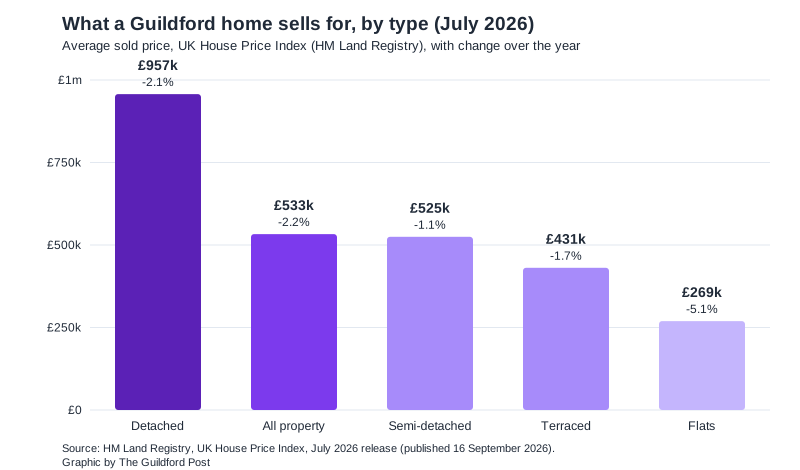
- Detached houses: £957,291, down 2.1% on the year. The family homes of Merrow, Burpham and the villages, priced within sight of £1 million.
- Semi-detached houses: £524,961, down 1.1%. Almost exactly the borough average.
- Terraced houses: £430,810, down 1.7%. The usual route into a house rather than a flat, common around Stoughton and the town centre.
- Flats and maisonettes: £269,364, down 5.1%, the sharpest fall of any type. Flat buyers are the most exposed to mortgage costs, and it shows.
A first-time buyer in the borough paid an average of £392,308 in July 2026, while a home mover, someone selling one home to buy another, paid £681,397. The £289,000 gap between those two figures is the size of the step from a first flat or terrace to a family house in this part of Surrey.
The most expensive streets, and the cheapest
Street-level sold-price records compiled by Property Solvers from HM Land Registry data over the past five years put the top of the Guildford market on the wooded slopes just south of the town centre:
- Fort Road (GU1 3TE), average £3,325,000
- Warwicks Bench (GU1 3TG), average £2,955,625
- Fort Road (GU1 3TD), average £2,915,000
- Guildown Avenue (GU2 4HB), average £2,487,500
- St Omer Road (GU1 2DB), average £2,151,666
Fort Road and Warwicks Bench run along the hill above the castle; Guildown Avenue climbs the Mount on the other side of the river. At the opposite end of the same dataset, the borough’s cheapest addresses are retirement and sheltered developments, led by Reeve Court on Tarragon Drive (GU2 9YS) at an average of £91,278. From £91,000 to £3.3 million is the honest range of what “Guildford house prices” means street by street.
How Guildford compares
| Area | Average price | Change over a year | Source |
|---|---|---|---|
| Guildford borough | £532,917 | -2.2% | UK House Price Index |
| Surrey county | £522,523 | -0.4% | UK House Price Index |
| South East region | £380,878 | +0.2% | UK House Price Index |
| England | £293,479 | +1.1% | UK House Price Index |
Two comparisons are worth reading carefully. On the official index, Guildford sits above the Surrey county average of £522,523, by about £10,400. That gap had almost closed in June and has widened again, because Guildford rose 1.3% in July while the county rose 0.5%. Against the country as a whole, the average Guildford home still costs £239,438 more than the average English one, falling market or not. The pull is the same as ever: fast trains to Waterloo, the University of Surrey, and countryside on three sides of the town.
A note on the numbers you will see elsewhere. Rightmove puts Guildford’s overall average at £556,803 for the year to April 2026, down 4% on the year before and 6% below the 2022 peak of £594,267. That is not a contradiction: Rightmove’s figure covers the GU town postcodes over a full year, while the UKHPI figure is a single month for the local-authority borough. Both agree on the direction, which is down.
What it means for you
If you are selling, price for the market that exists now, not the one of 2022. Sold prices are still about 2% below last year and £22,352 below the 2025 peak, although the gap is narrowing month by month. If you are buying, flats in particular, down 5.1% in a year, are where sellers have least room to argue. Factor in the council tax band of anything you view, since a Band G bill in Guildford clears £4,000 a year. If you are staying put, a paper fall of 2.2% follows years of strong gains, and it changes nothing unless you remortgage or move.
One thing to watch: the amount of building the borough is asked to absorb over the next decade is being decided now, through the new Local Plan. Where those homes go will shape values street by street; our Guildford planning news page follows it.
Frequently asked questions
What is the average house price in Guildford?
The average home in Guildford borough sold for £532,917 in July 2026, according to the provisional UK House Price Index built from HM Land Registry completed sales. Town-postcode averages weighted to a full year read higher, around £557,000 on Rightmove.
Are Guildford house prices falling?
Yes over the year, but the fall is easing. Prices fell 2.2% in the twelve months to July 2026, with every property type down and flats falling hardest at 5.1%. Month to month, July rose 1.3%, the second rise in a row. England as a whole rose 1.1% over the year.
How much is a detached house in Guildford?
A detached house in the borough averaged £957,291 in July 2026, roughly £432,000 more than the average semi-detached home.
Where are the most expensive streets in Guildford?
On the hills either side of the town centre: Fort Road and Warwicks Bench above the castle, and Guildown Avenue on the Mount, all averaging £2.4 million to £3.3 million over the past five years of Land Registry sales (Property Solvers).
Is Guildford cheaper than the rest of Surrey?
No, not on the official index. Guildford’s £532,917 sits above the Surrey county average of £522,523, although the county figure is held up by Elmbridge and Surrey’s other super-prime pockets while Guildford’s own average includes its cheaper corners around Ash and Park Barn. Guildford remains far above the England average of £293,479.
Where can I check what a specific house sold for?
Every completed sale in England and Wales is public. Search a street or address free on the HM Land Registry sold-price service, or browse the same data on Rightmove and Zoopla.
Sources
- UK House Price Index, Guildford (E07000209), via the Land Registry UKHPI data service, for all borough, Surrey, South East and England figures (July 2026, provisional)
- Property Solvers Guildford sold prices for street-level extremes (HM Land Registry data, five years)
- Rightmove Guildford house prices for the town-postcode yearly average and peak comparison
- HM Land Registry sold-price search to check any individual address
Figures are provisional and revised as more sales are registered. Checked against the sources above on 18 September 2026.
Have your say